Data Analytics with Power BI
This training will help you create real-time reports with self-thinking business intelligence. Through the training, you will understand all the components of the Power BI program, see how they work together, and gain the skills to create attractive visual dashboards. In this training, you will learn the techniques required to easily and quickly obtain data from any source with Power BI, the latest Business Intelligence tool introduced by Microsoft, and prepare meaningful, beautiful, and dynamic reports in minutes. Moreover, you will not need to wait for an IT specialist or technical support for this.
Training table
Data Analytics with Power BI
Data Analytics with Power BI
Datenanalyse mit Power BI
Аналитика данных с помощью Power BI
Information about the training
The training will mainly teach you all the Power BI components needed to prepare reports and dashboards, from simple data analysis to complex business scenarios - Power Query (Get Data & Transform), Power BI Desktop (Data Modeling & DAX, Data Visualization) and Power BI Service (online web version) to share your reports. The training will then explain how to use visualization components such as various types of graphs, dashboards and scenarios and share them with administrators, managers and related department employees. After preparing reports, analyses and dashboards in the computer version of Power BI (Desktop), you and your authorized employees will be able to control, change interactively and see the information you want with a single touch via an internet browser and mobile phone. You will master the knowledge and skills taught during the training by applying them to Retail (Sales), Finance, HR, CRM and Telecommunications cases.
Who is this training for?
Those who have not worked with Power BI yet and want to learn how to use this program,
Excel users who want to create professional reports in Power BI,
Data analysts who want to improve their data modeling, dashboard design skills and BI knowledge,
Specialists and managers in Marketing, Finance, Sales and Human Resources and other fields,
Business Managers, Business Analysts, Data Analysts,
Anyone who is studying Data Analytics and is interested in this field and preparing reports from large volumes of data.
Certificate
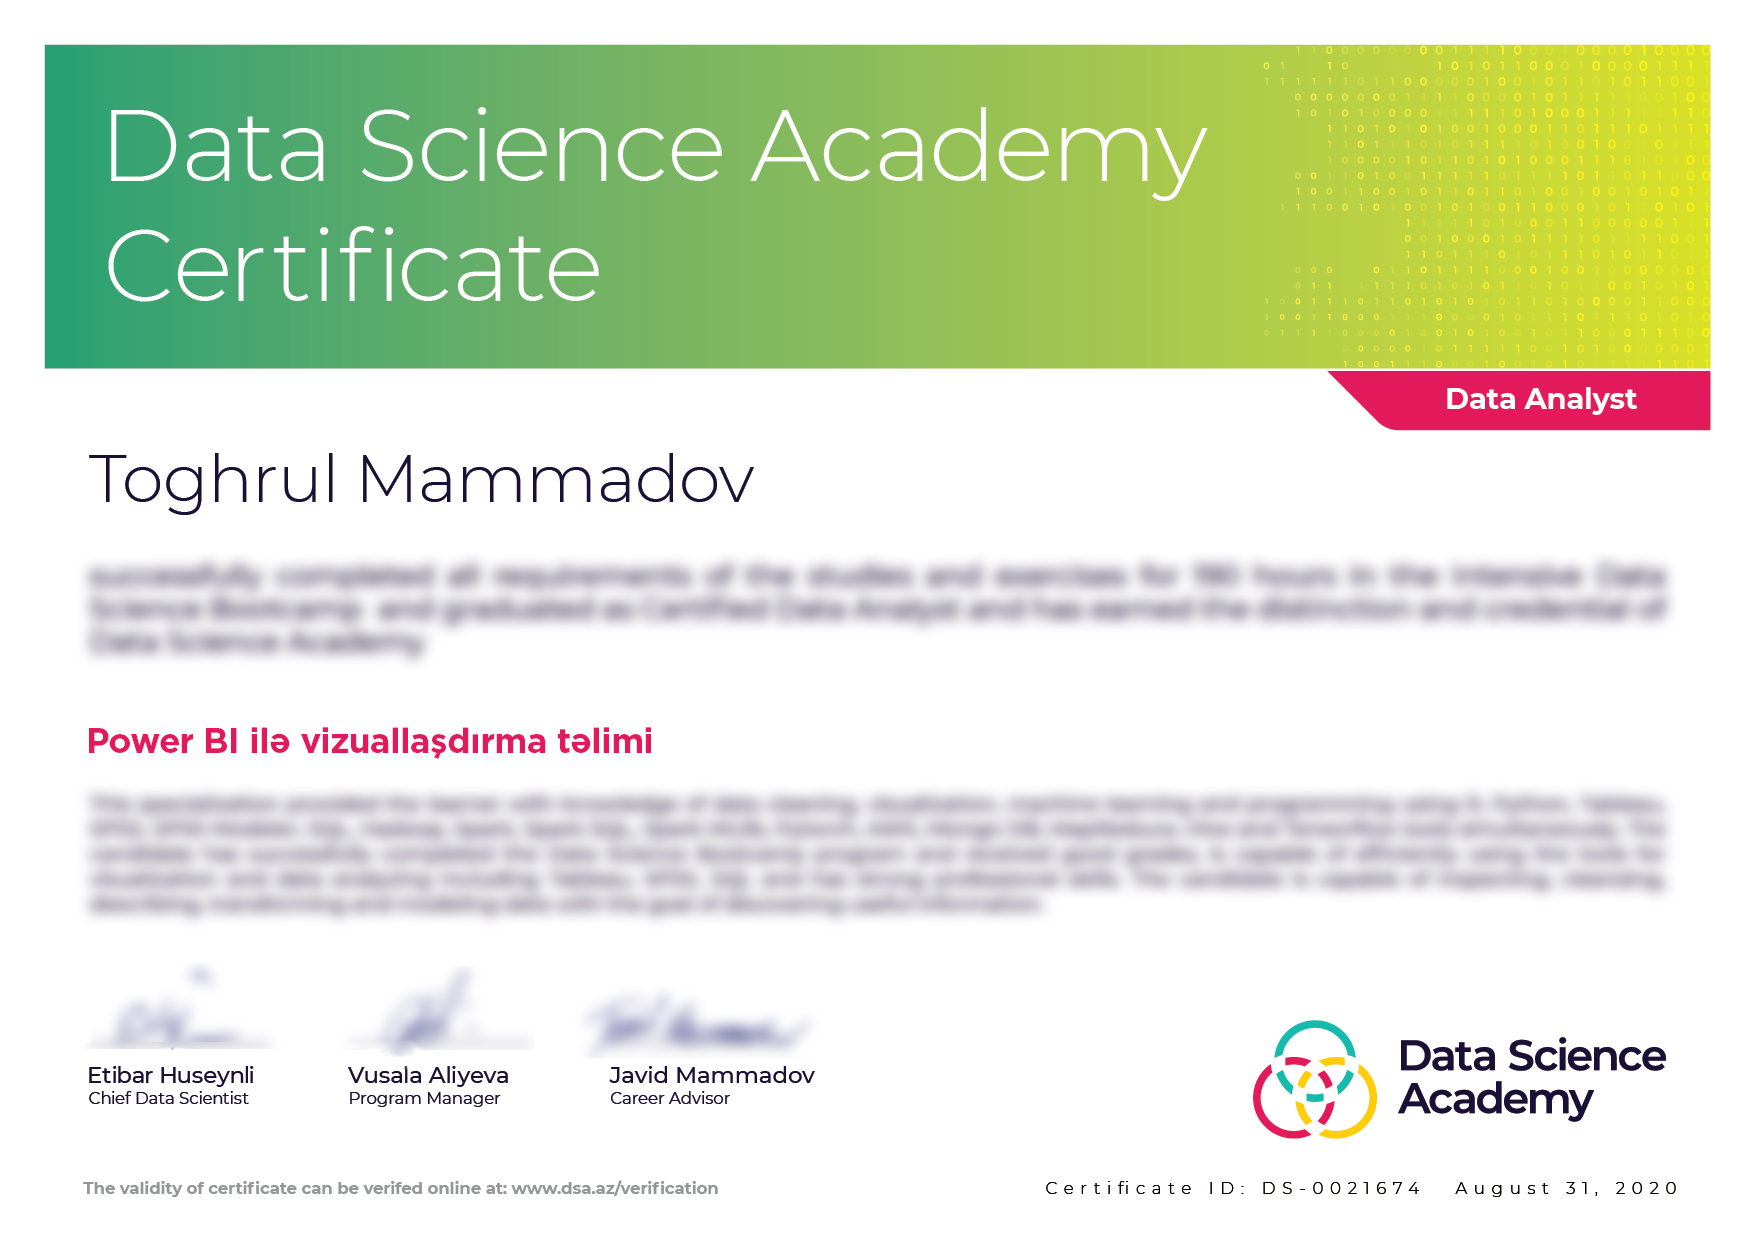
Participants who successfully complete the training will be awarded the Certified Data Analyst certificate, while other participants will receive a participation certificate. You can see a sample certificate on the right.

Power BI Tutorial for beginners
Power BI for Data Analytics
Kevin Stratvert
In this step-by-step tutorial, learn how to use Microsoft Power BI in just 10 minutes. Video Courtesy: Kevin Stratvert
Syllabus
Session 1
- Introduction to Power BI: What is Power BI Desktop and Power BI Service?
- Introduction to Power BI components: Power Query, Power Pivot, Power View.
- Data acquisition and transformation - Power Query.
- Data cleaning.
- Data modeling and working with DAX formulas.
- Practical work with real data: Organizing CRM, Sales, and Telecommunications data.
Case Study 1
Data transformation using Supermarket Sales data.
Session 2
- Initial Visualization in Power BI: Advanced visuals, Slicers.
- Slicing and Dicing, filters, data hierarchy - drill down/up.
- Building dashboards and reports in Power BI Desktop.
- Practical work: Creating dashboards based on cleaned data.
Case Study 2
Applying the taught topics to real situations using Property Sales Data.
Session 3
- Types of Filters: Visual Level Filter, Page Level Filter, Report Level Filter.
- DAX functions, DAX Iterators, Averagex, Sumx, Countx, Maxx, Minx.
- Table formulas: Previous month, Same period last year, Use Relationship, Filter, Divide, All.
Case Study 3
Applying the taught topics to real situations using Sales Analysis data.
Session 4
- Professional Dashboard Design with Advanced Visualization.
- Sharing data through Power BI Service and Mobile.
- Managing dashboards with interactive techniques.
- Dashboard design, sharing, and usage of reports.
Case Study 4
Analysis of worldwide coronavirus data.