Tableau for Data Analytics
In an era where data is crucial for decision-making, it’s not difficult to explain what you might lose by not mastering your data. This training, which covers Tableau—considered the "Gold Standard" of interactive visual representation and has maintained its leadership in the globally renowned "Gartner" rankings for 5 consecutive years—focuses on mastering data, i.e., "seeing" and "understanding" it. The training program includes not only creating static graphs but also developing the necessary interactive dashboards to uncover important information hidden within your data.
Training table
Tableau for Data Analytics
Tableau for Data Analytics
Tableau für Datenanalyse
Tableau для анализа данных
Information about the training
The training aims to equip participants with the ability to transform data, which may initially appear as mere numbers, into visual representations that answer critical questions such as "how," "why," and "where" when defining policies for departments like marketing, sales, and human resources. This includes developing the skills to create visualizations that provide insights into processes, control mechanisms, and deeper analyses. The compelling results of these visualizations will encourage participants to perform more in-depth analyses and inspire continuous improvement. This training is designed for those responsible for reports, individuals looking to advance in data analytics, and anyone seeking to add Tableau—known for generating an annual income of $100,000 according to "Glassdoor"—to their skill set.
Who is this training for?
Those who have not worked with Tableau so far and want to learn how to use the program, SQL and Excel users who wish to prepare professional reports in Tableau, programmers interested in learning analytics, data analysts looking to improve their skills in data modeling and dashboard design, Excel users, marketing, sales, and human resources professionals, Data Analysts, those learning and interested in Data Analytics, anyone preparing reports from large datasets, and anyone looking to build a career in Data Analytics.
Certificate
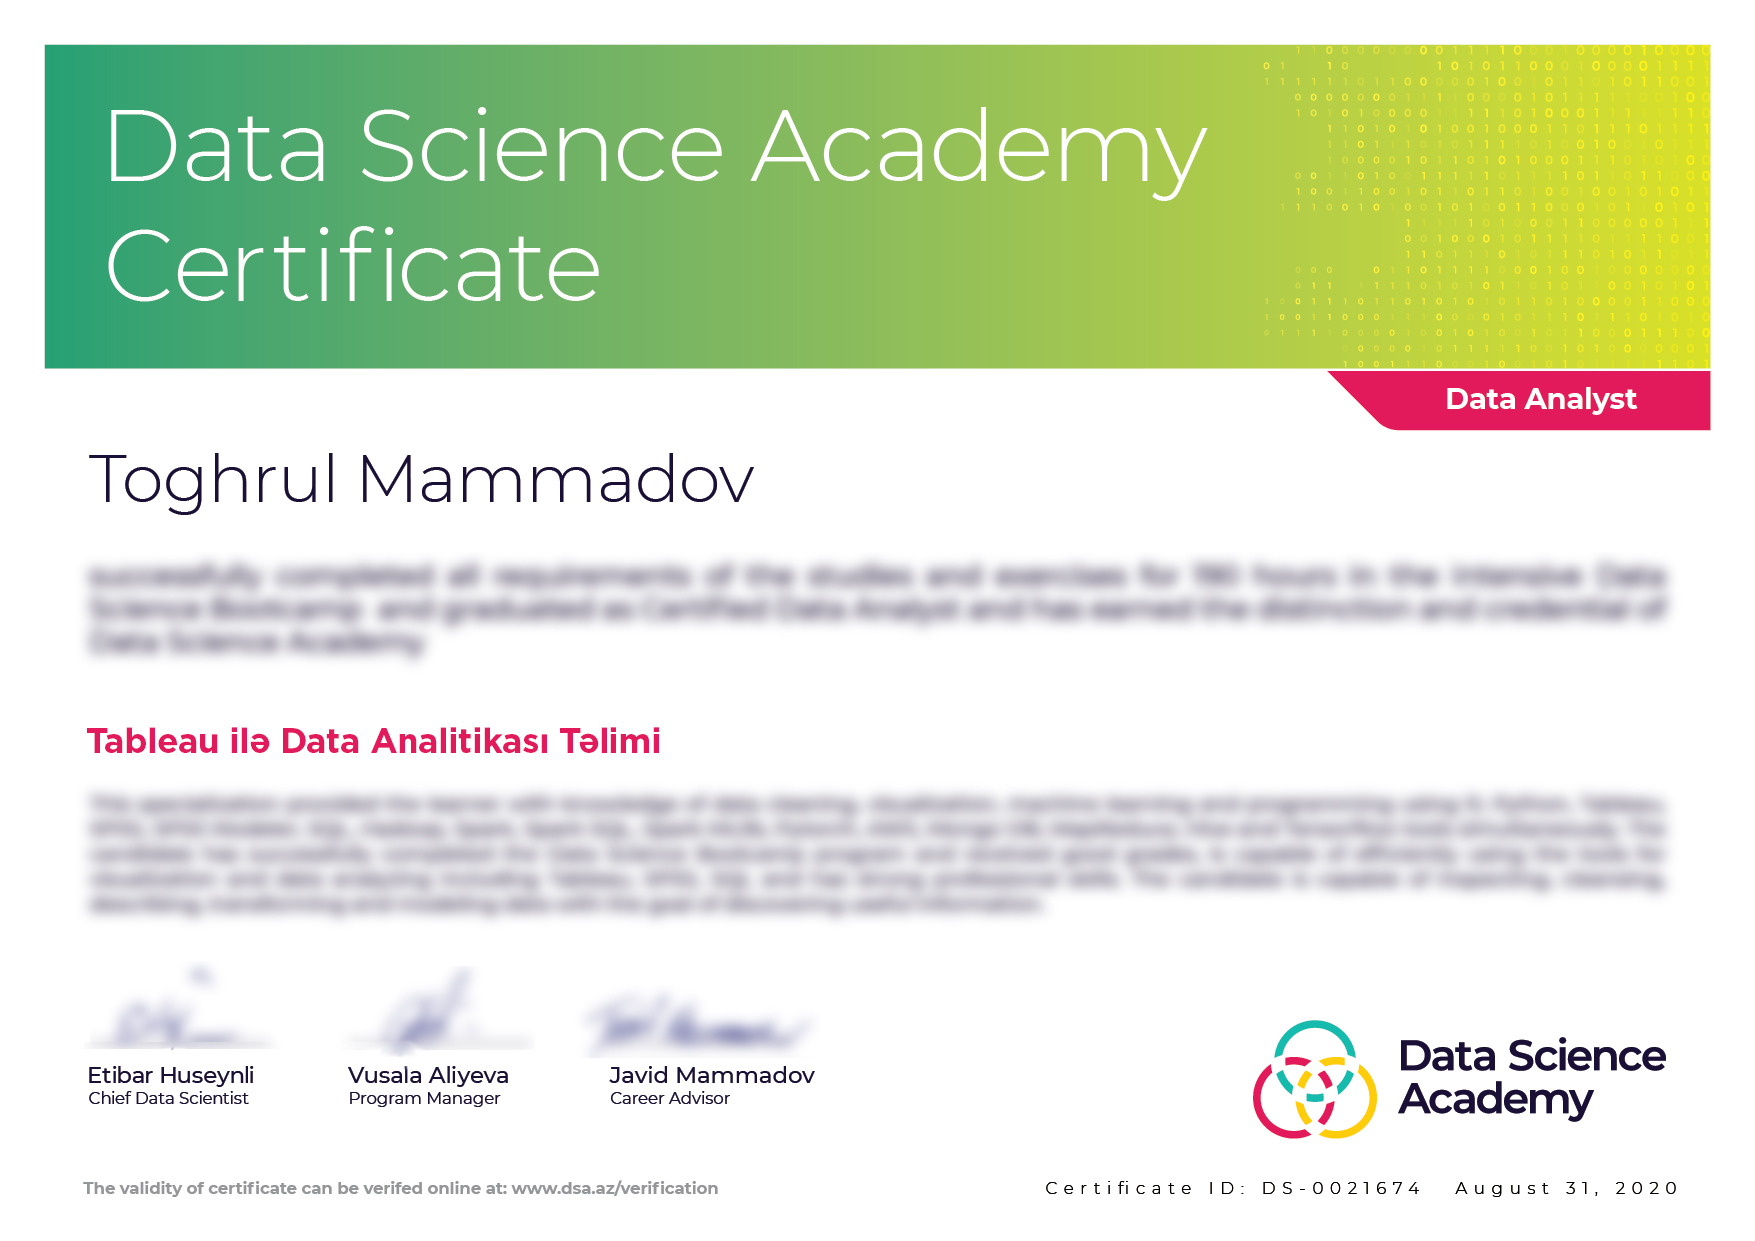
Individuals who successfully complete the training will be awarded the Certified Tableau for Data Analytics certificate, while others will receive a participation certificate. A sample certificate can be seen on the right.

What is Tableau ? Explained in under 10 mins!
Tableau for Data Analytics
Tableau Tim
This video summarises the Tableau platform and how it fits into the Analytical flow in every business. Video Courtesy: Tableau Tim.
Syllabus
Session 1
- Introduction to Tableau
- Adding Data
- Combining Tables
- Types of Variables and Their Usage
- Creating Charts - Bar, Pie Chart, Donut Chart, Treemap
Case Study 1
Sales Analysis
Session 2
- Creating New Variables and Performing Calculations on Them
- Level of Detail Calculations
- Creating Complex Charts and Maps, such as Area Chart, Waterfall, Histogram, Funnel Chart
Case Study 2
Analysis of Visa Applications
Session 3
- Creating and Applying Groups to Simplify Data
- Creating Static and Dynamic Sets
- Applying Parameters and Linking Parameters with Sets
- Creating Two-Dimensional and Three-Dimensional Charts - Scatter Plot and Bubbles
Case Study 3
Analysis of Turbocar Vehicle Sales.
Session 4
- Introduction to Dashboards. Designing the Layout of a Dashboard.
- Integration of Charts
- Visualizing Data Distribution and Identifying Outliers (Boxplot)
- Time Series Analysis
- Advanced Design Techniques
Case Study 4
Creating a Churn Analysis Dashboard.
Session 5
- Creating Complex Calculations Using Index, Case, and Lookup
- Comparing Data with Bump and Dumbbell Charts
- Applying Filter and Highlight Actions
Case Study 5
Analysis of Tourism Data
Trainers

Minura Huseynli
Head of Data Analytics and Reporting, Digital UmbrellaMinura Huseynli has over 8 years of professional experience in the data field. She currently works as the Head of Data Analytics and Reporting at Digital Umbrella. She has worked as a consultant on many local and international data science projects across different sectors. She has led teams of up to 10 people during project implementation. She currently provides data science services for several companies. She has extensive practical knowledge in advanced statistics, machine learning with Python, data management with SQL, visual analytics with Tableau and other BI programs, and obtaining strategic information from data.

Şəbnur Pənahlı
Business Analyst, Kapital BankShabnur Panahli, who has over 4 years of experience in data science, is a Business Analyst in one of the leading teams in the banking sector. The teacher has extensive knowledge in the fields of data analysis, machine learning algorithms, and data visualization. His main skills include Tableau, R, Python, SPSS, SQL, and statistical analysis tools. He is also a holder of international certificates such as PMP, PMI-ACP, PMI-PBA.