
Excel for Data Analytics
In the training, you will learn how to write simple and advanced functions for Excel products and analysis, filter, format, use multiple Excel documents as a single source, build advanced visual dashboards, write macros to automate operations and develop other operations with software in a very simple and practical way. This will help you perform data calculations, optimize the process of preparing daily, weekly, monthly reports and analyses. The training is designed in a way that people who have no previous Excel experience can easily understand and learn a large number of new practical data analysis methods for effective Excel professionals.
Training table
Excel for Data Analytics
Excel for Data Analytics
Datenanalyse für Excel
Excel для анализа данных
Information about the training
In this training, you will learn how to analyze data by applying the most commonly used features of Excel from simple to complex, and you will be able to obtain meaningful results from data by analyzing it easily, quickly and in more detail with Pivot tables. Regardless of the field you work in (marketing, sales, finance, HR or other), you will be able to visualize your data from simple tables to complex and dynamic dashboards and build various models (e.g. sales forecast) using Excel. In addition, you will be able to conduct "what if" analysis, work with Pivot Tables, automate your repetitive operations with Power Query and macros, and easily analyze data in your enterprise and make quick decisions using the most commonly used functions of Excel. During the training, all topics will be explained to you through easy-to-understand practical exercises. In addition, you will develop your analytical skills with Excel by applying the knowledge you have learned on various business data through the keys presented in the training.
Who is this training for?
- Beginner and intermediate Excel users,
- Business professionals using Excel,
- Experts and managers in Finance, Sales and Human Resources and other fields, current, business Managers, Business Analysts, Data Analysts, those learning Data Analytics, those interested in this field, and those who prepare reports from large volumes of data.
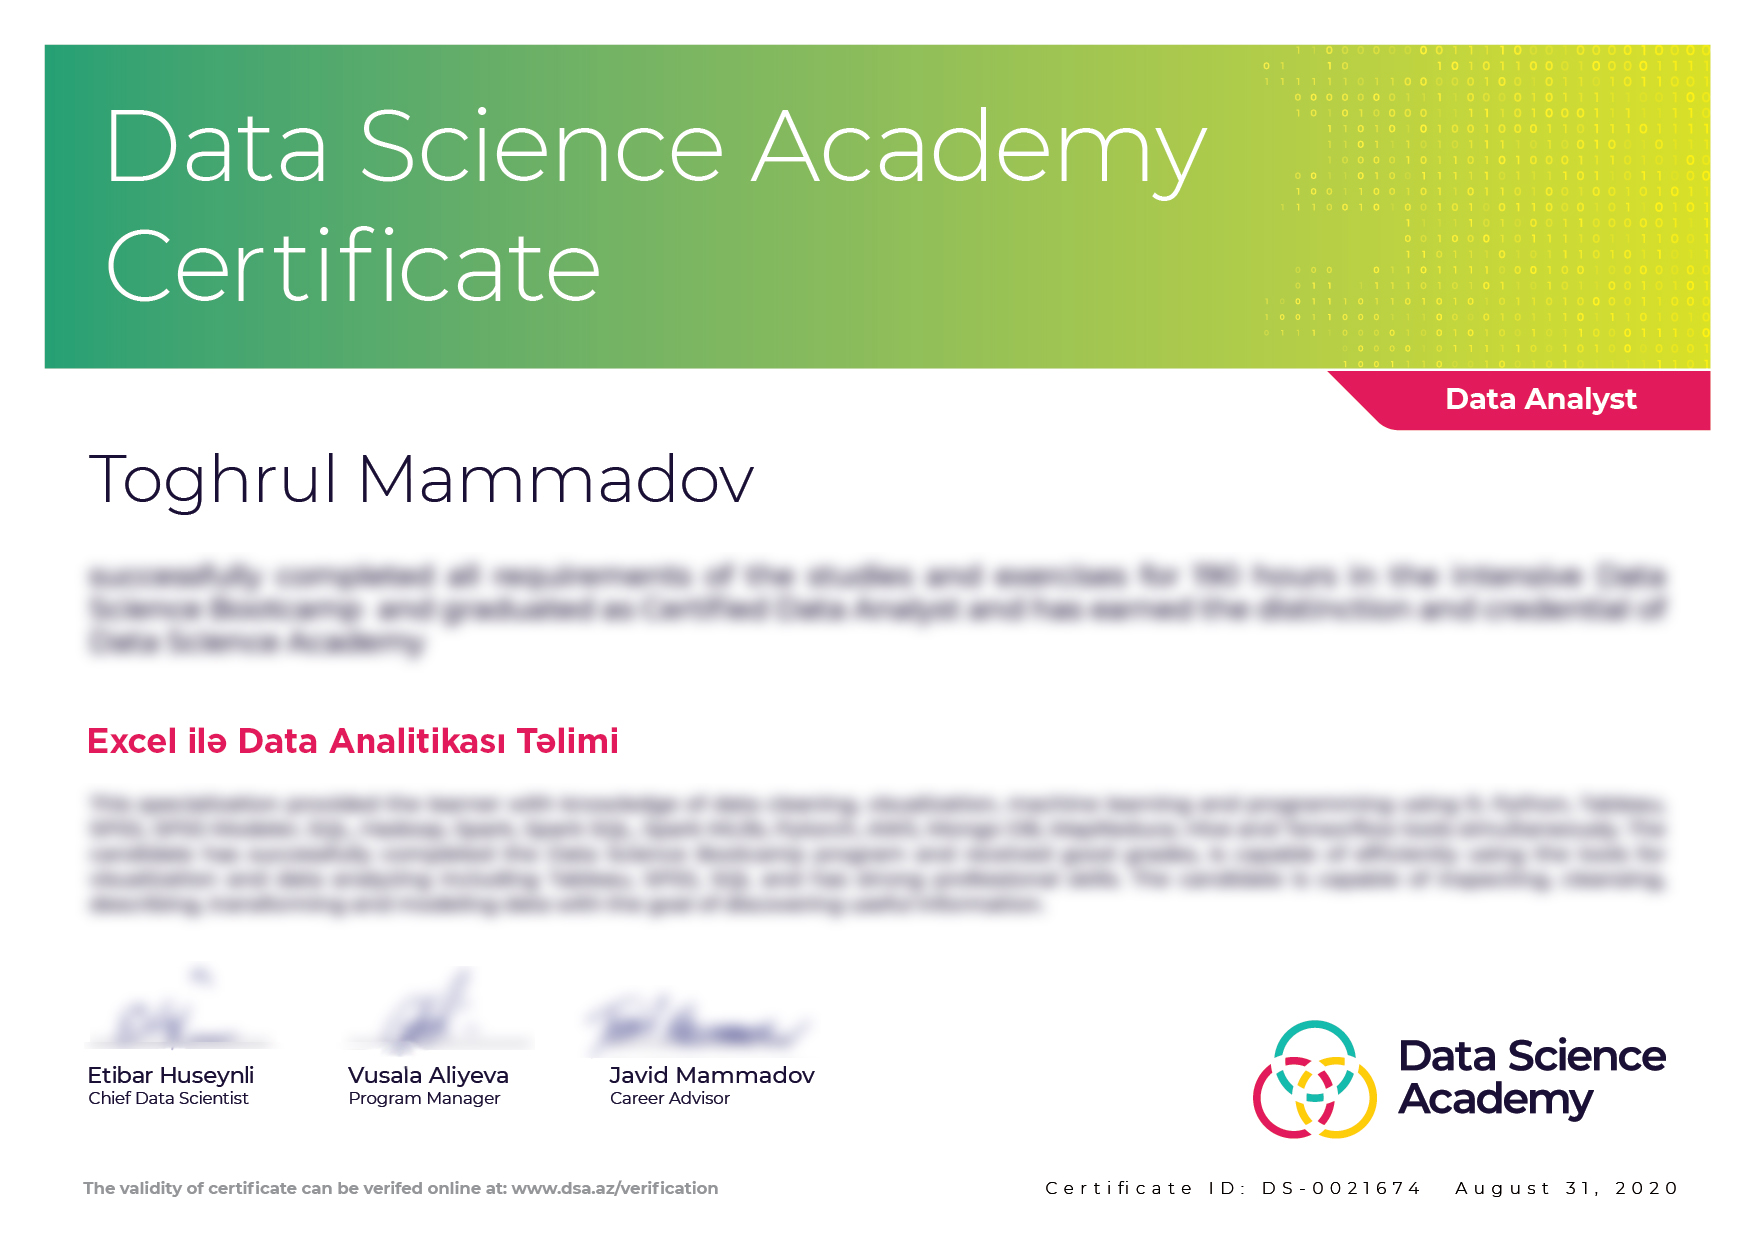
Certificate
Participants who successfully complete the training will be awarded the Certified Excel for Data Analytics certificate, while other participants will receive a participation certificate. You can see a sample certificate on the right.
Excel for Data Analytics
Excel for beginners
Kenji Explains
This video will give you a basic understanding of Data Analytics with Excel. The video is by Kenji Explains.
Syllabus
Session 1
- Introduction to Excel
- Data Types
- Filtering and References
- Data Manipulation with Excel
- Data Cleaning and Data Validation
- Creating Charts
- Keyboard Shortcuts
Case Study 1
Operations on Sales Data
Session 2
- Conditional Formatting
- Advanced Excel Functions
- Conditional Statements
- Text Functions
Case Study 2
Operations on Game Sales Data.
Session 3
- Data Analysis with Pivot Tables
- Data Analysis with Pivot Charts
Case Study 3
Operations on Film IMDb Data.
Session 4
Application of Excel Functions and Dashboard Creation.
Case Study 4
Building a Dashboard
Sessiya 5
Pivot Table ilə data analizi: Pivot Table ilə data formatlama, sorting, filtering, qruplaşdırma, calculated values və fields
Pivot chart ilə vizuallaşdırma: Slicer və Timeline,
İrəli səviyyə dasbhoard qurulması texnikaları: Formulalar ilə qrafiklər, Slicer və form nəzarəti
Case Study 5
Maliyyə datası üzrə gəlir və xərc üzrə dashboardun qurulması
Sessiya 6
Power Query ilə data əməliyyatları: Get data, merge və append data funksiyaları
Power Query Funksiyaları : M dili, İrəli səviyyə şərti məntiq, məxsusi (custom) funksiyaların yaradılması
Case Study 6
Bank datasında Power query ilə data emalı və avtomatlaşdırma
Session 7
- Writing and executing macros in Excel
- Creating macros with VBA
- Running macros using user buttons and shortcuts
- Enhancing macro performance and debugging errors
Case Study 7
Automated Sales Data Analysis: Accelerating the Process with Excel Macros